Blackboard Class Activity Dashboard
ED TECH TOOLBOX
text Heading link
Class Activity Dashboard is an instructor tool available in Fall 2022 Blackboard courses. It visualizes data for course engagement and individual student experience history. Giving instructors a birds-eye view of the last 7 days of class activity and opportunity to identify exceptions, instructors can then focus on individual students and the correlation of their activity, submission patterns, and grades. One of the insights for instructors is how students are using the course resources.
Class Activity Dashboard provides:
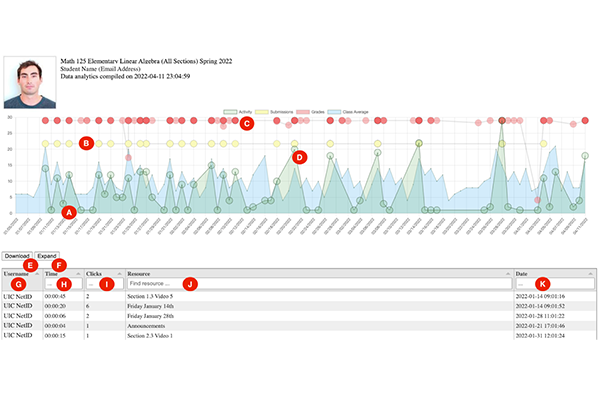
1. Class average activity as a background
2. Individual student activity
3. Frequency of digital submissions
4. Frequency and value of received grades
5. History of visited course areas
6. Access to student’s view of the Class Resources Dashboard
text 2 Heading link
Dashboard insights:
1. Identify users who withdrew from the course and view their recorded activity
2. Visualize chronological effort of students instead of running course reports
3. Identify grade outliers caused by entry mistakes or other unexpected situations
4. Download data for your own research or archive
5. Consider the dated grading events with overall activity
6. Identify the most frequently visited areas of the course
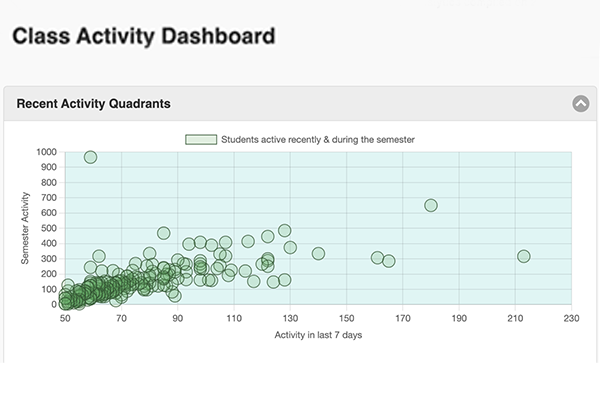
7. Check course engagement in Activity Quadrants
Students can also use the Class Resources Dashboard to help them identify parts of the course they have not yet reviewed. Learn how to use the Class Activity Dashboard.